Introducing FiDUS Sell Side
Your template. Your model. Written from the filings.
An initiating-coverage report in your desk’s own format and the linked three-statement model in your own workbook, generated from what the company filed, in one command, so their numbers agree. Every figure carries the document it was read from. The rating, the target price and the recommendation stay yours. One desk’s format, on Lupin, all eighteen pages. Keep scrolling and it turns. Send yours and the report comes back in it.
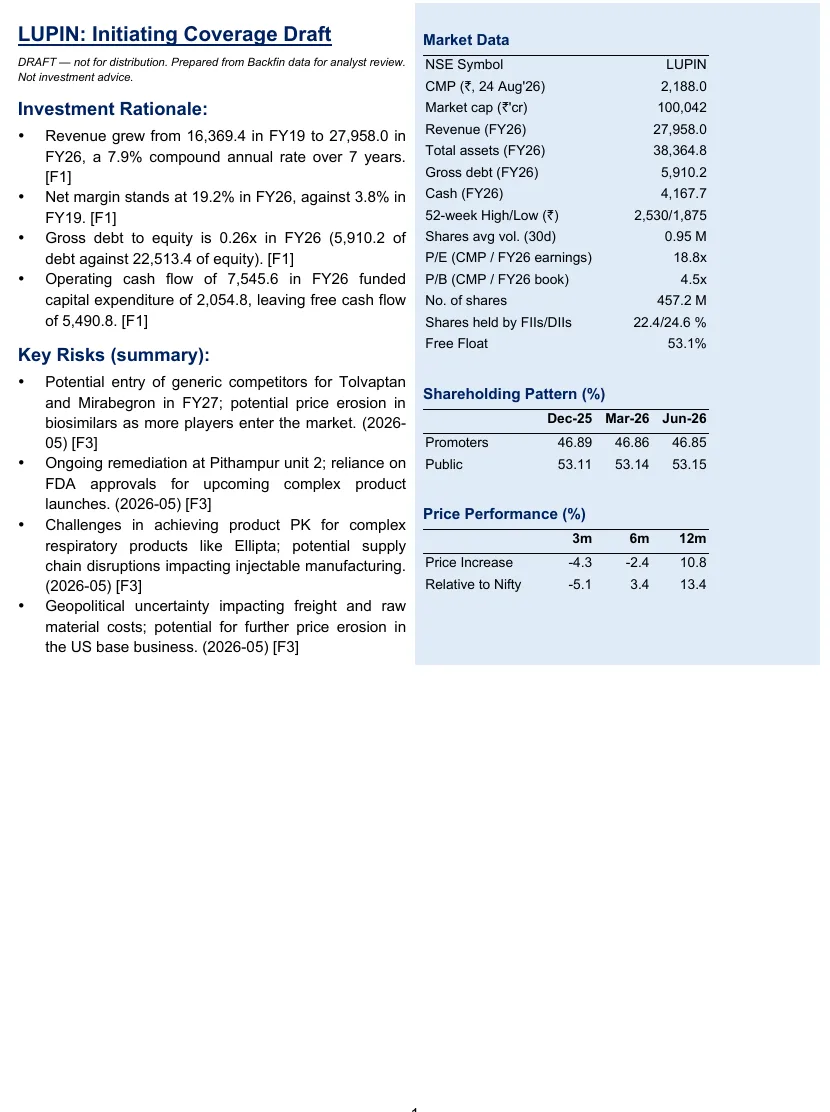
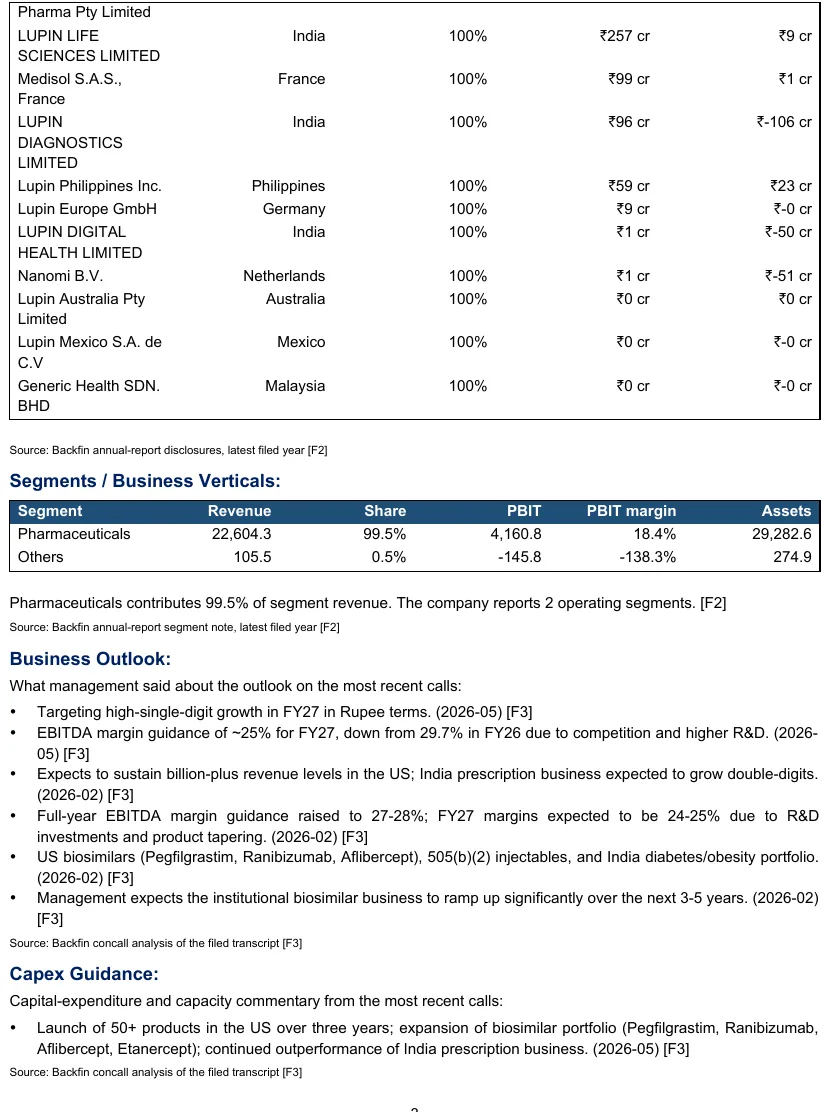
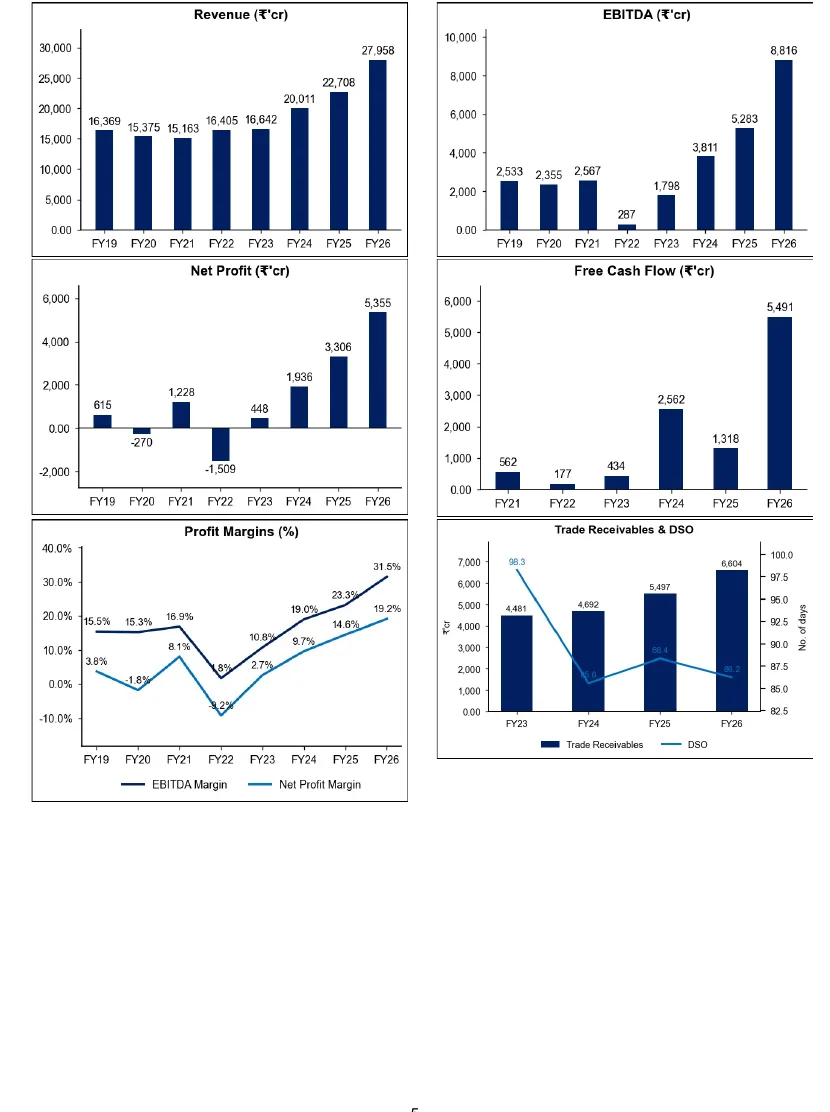
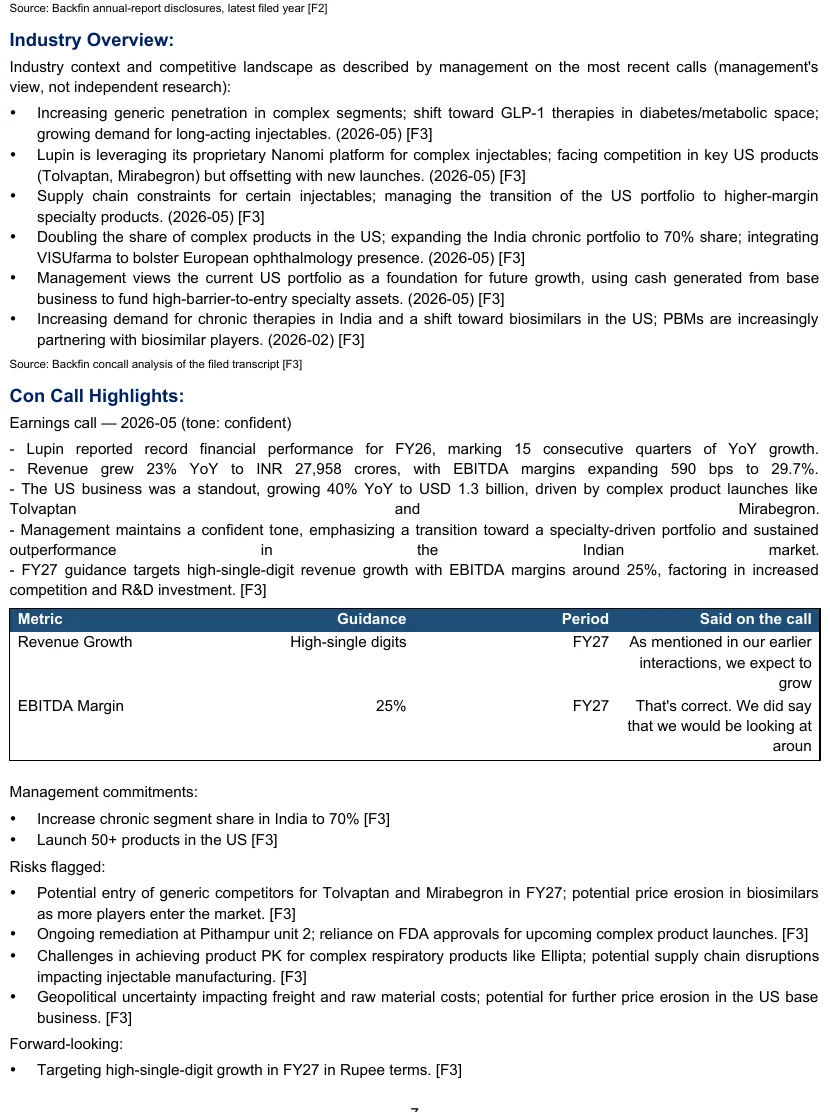
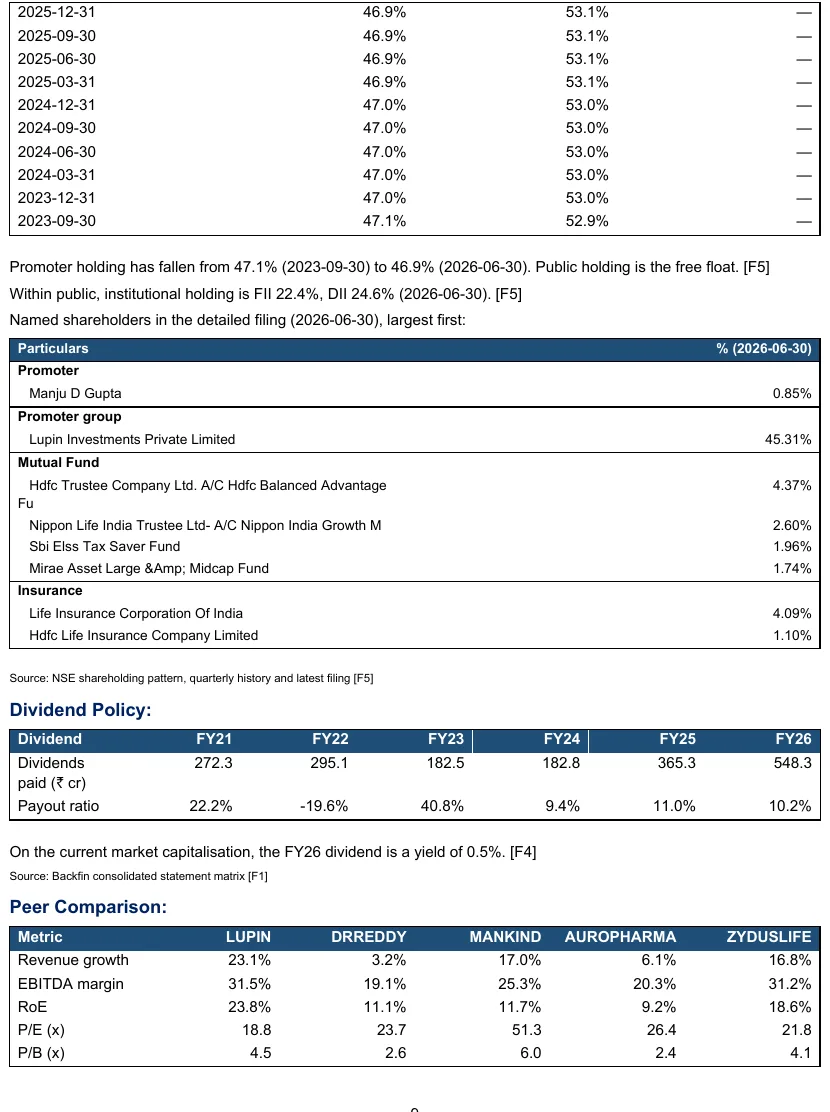
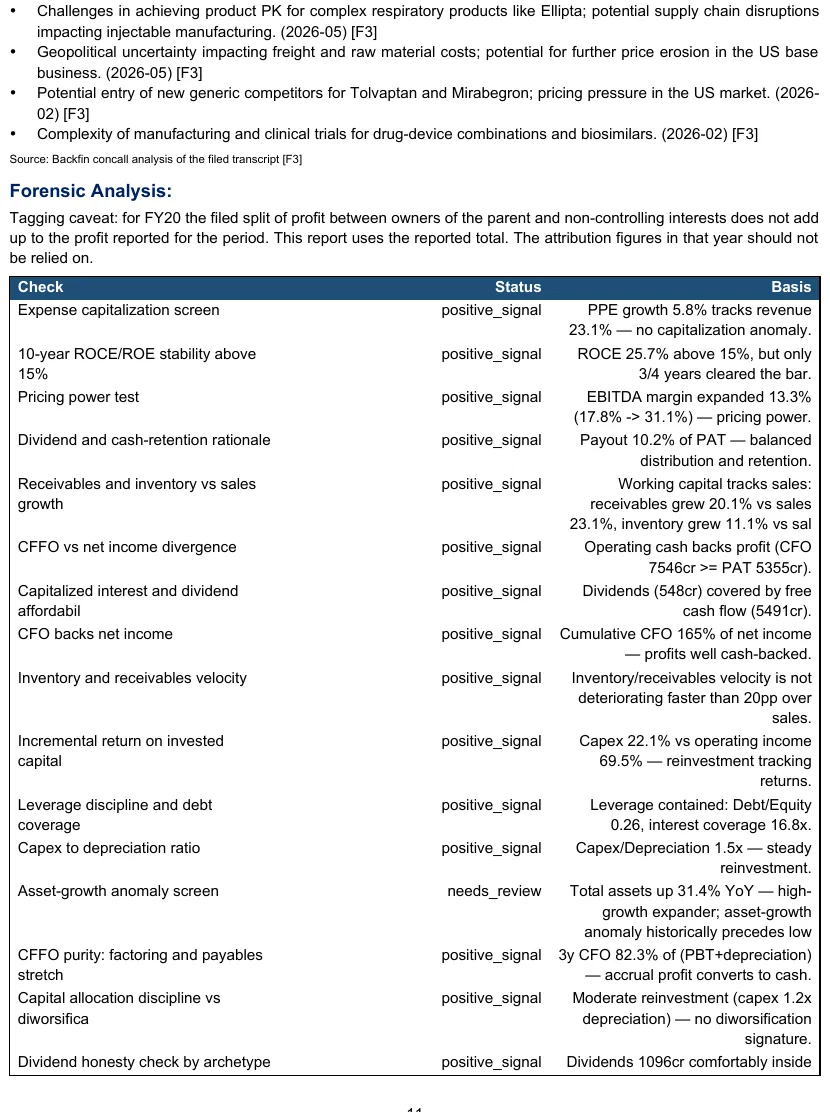
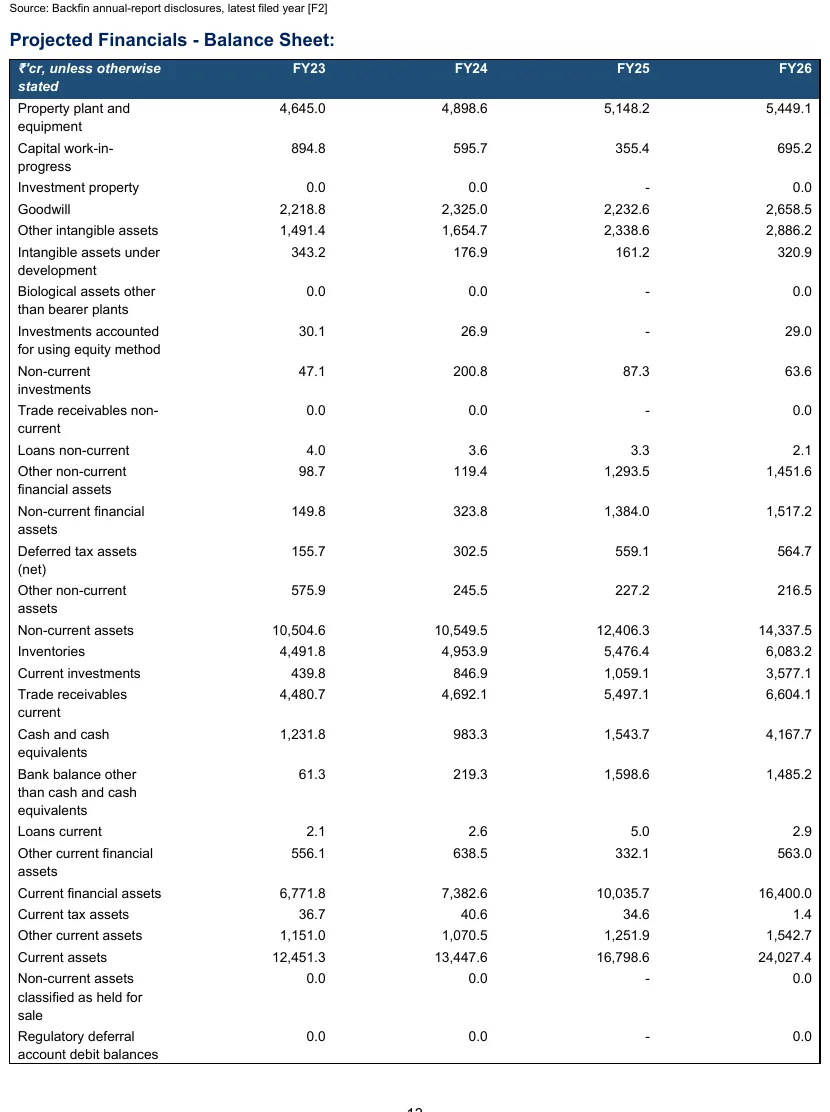
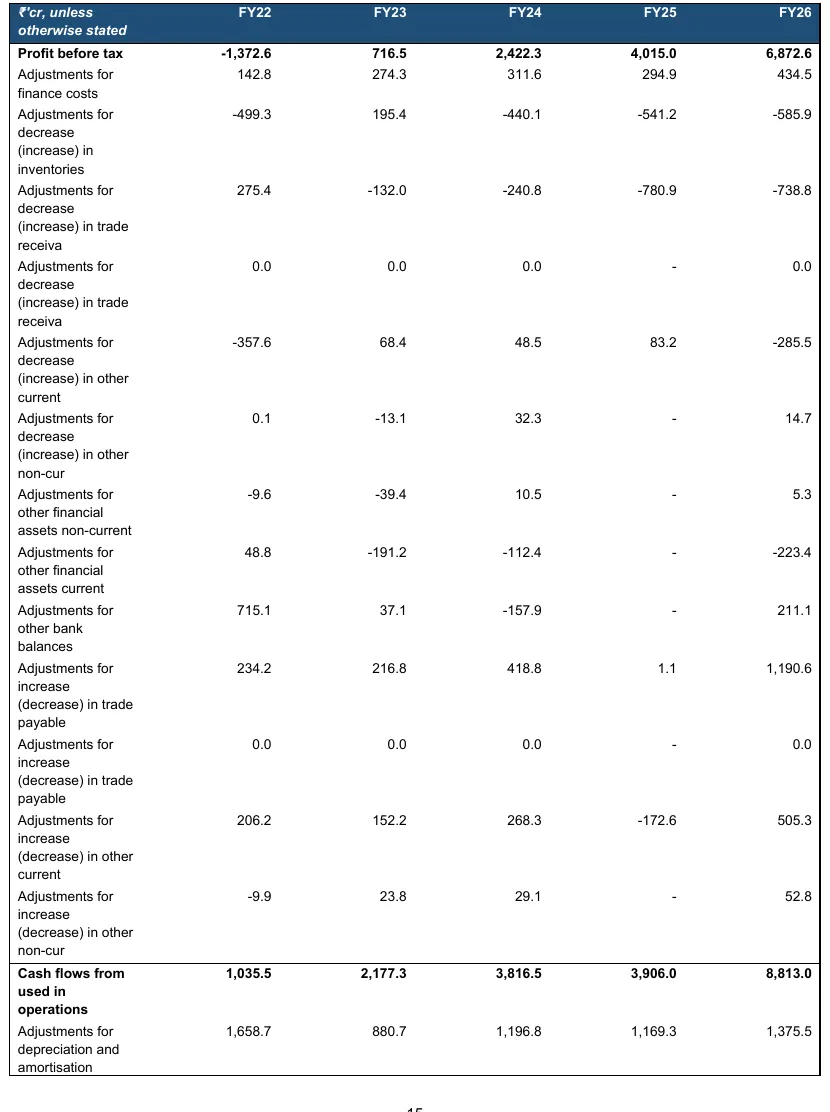
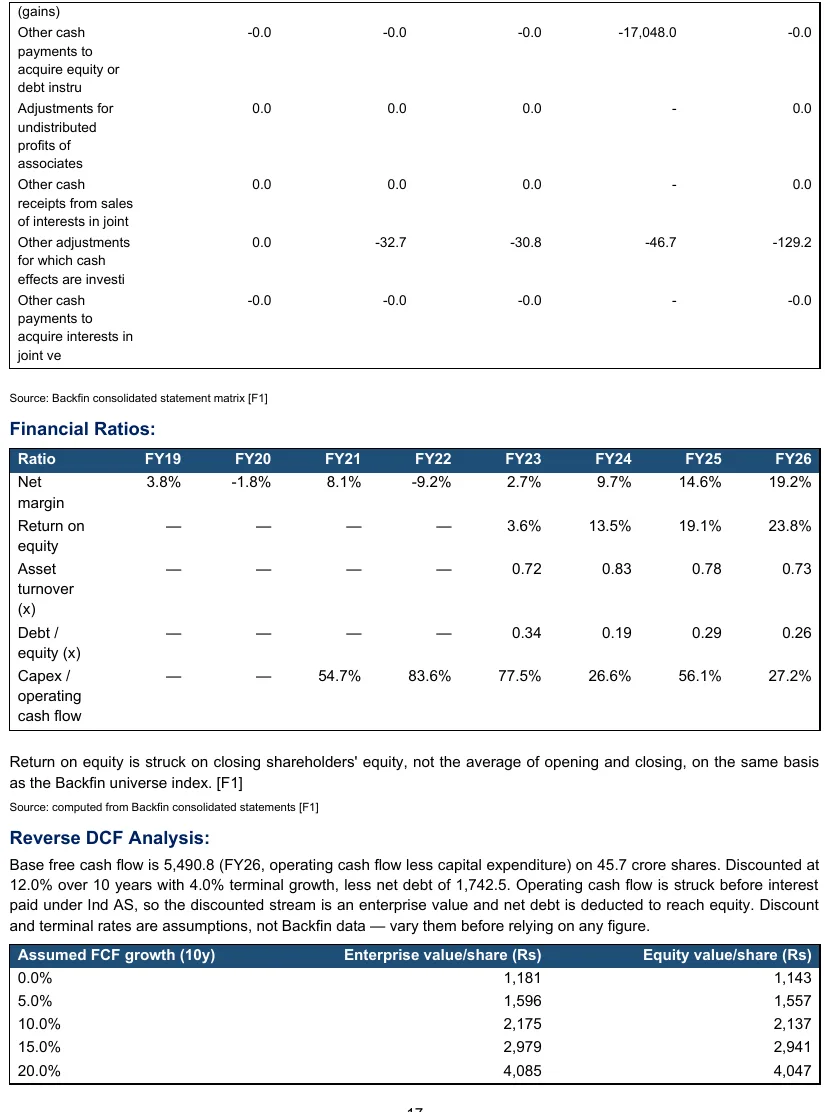
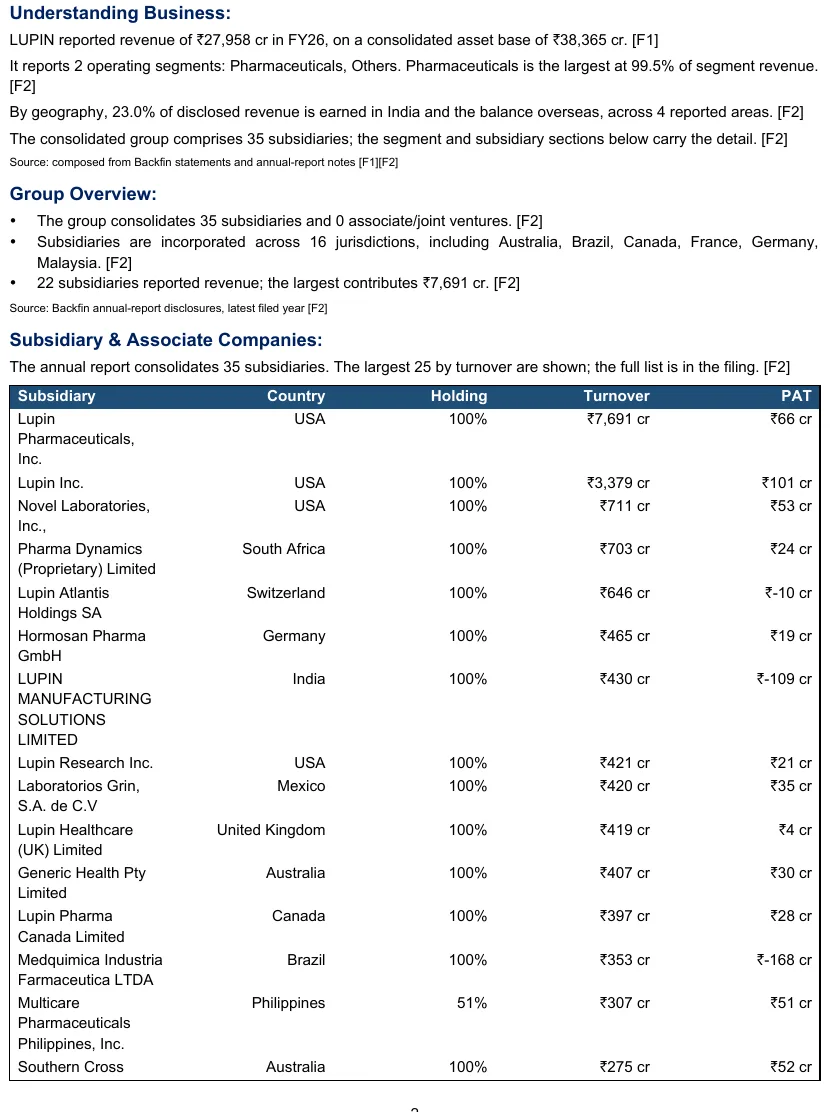
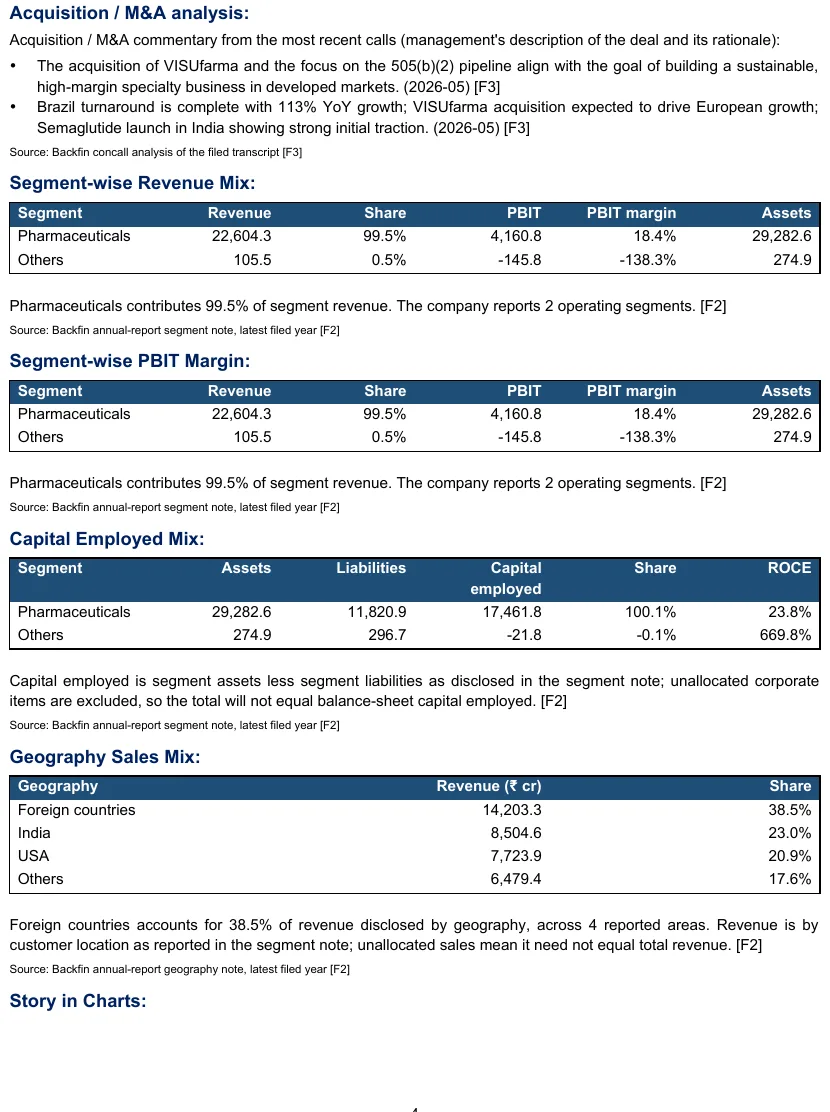
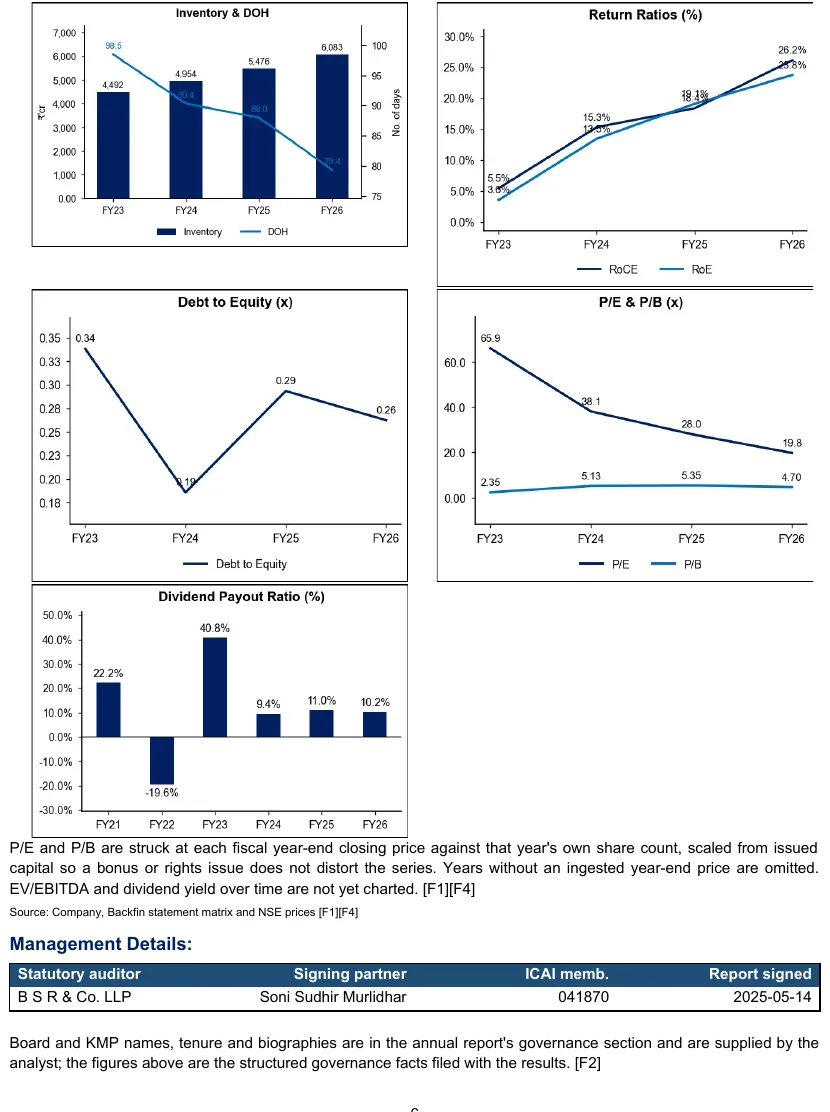
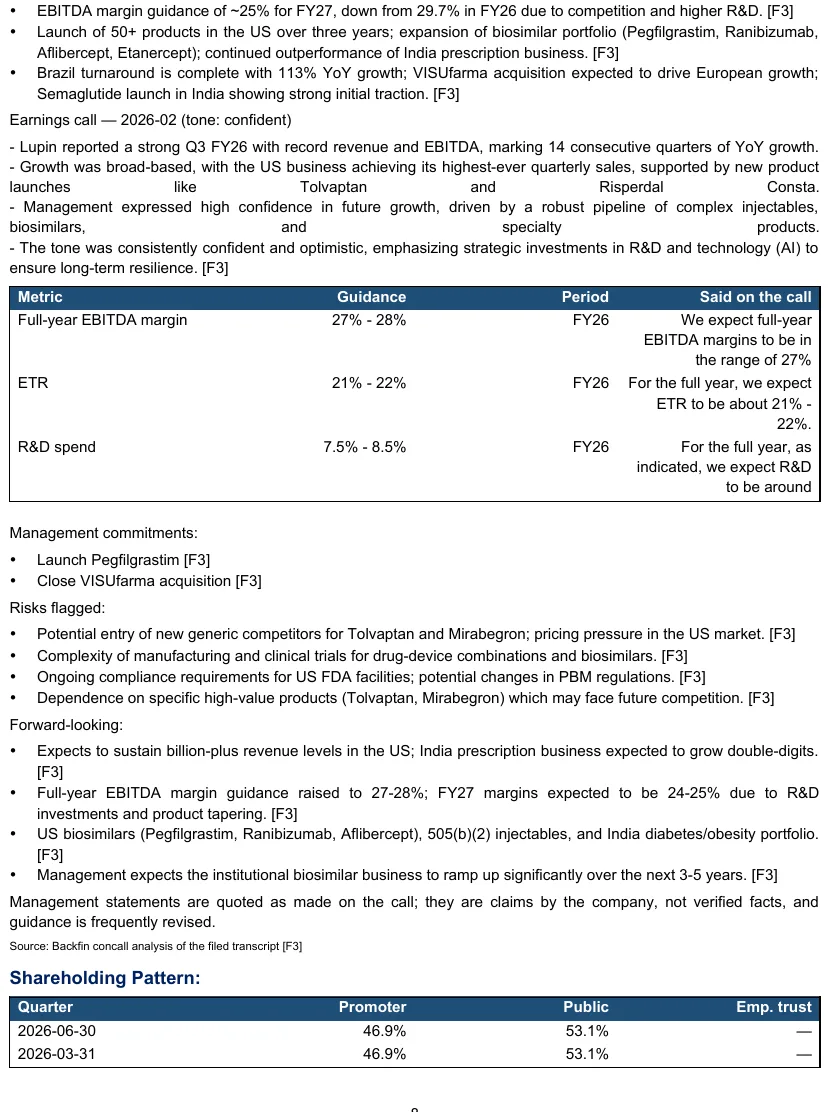
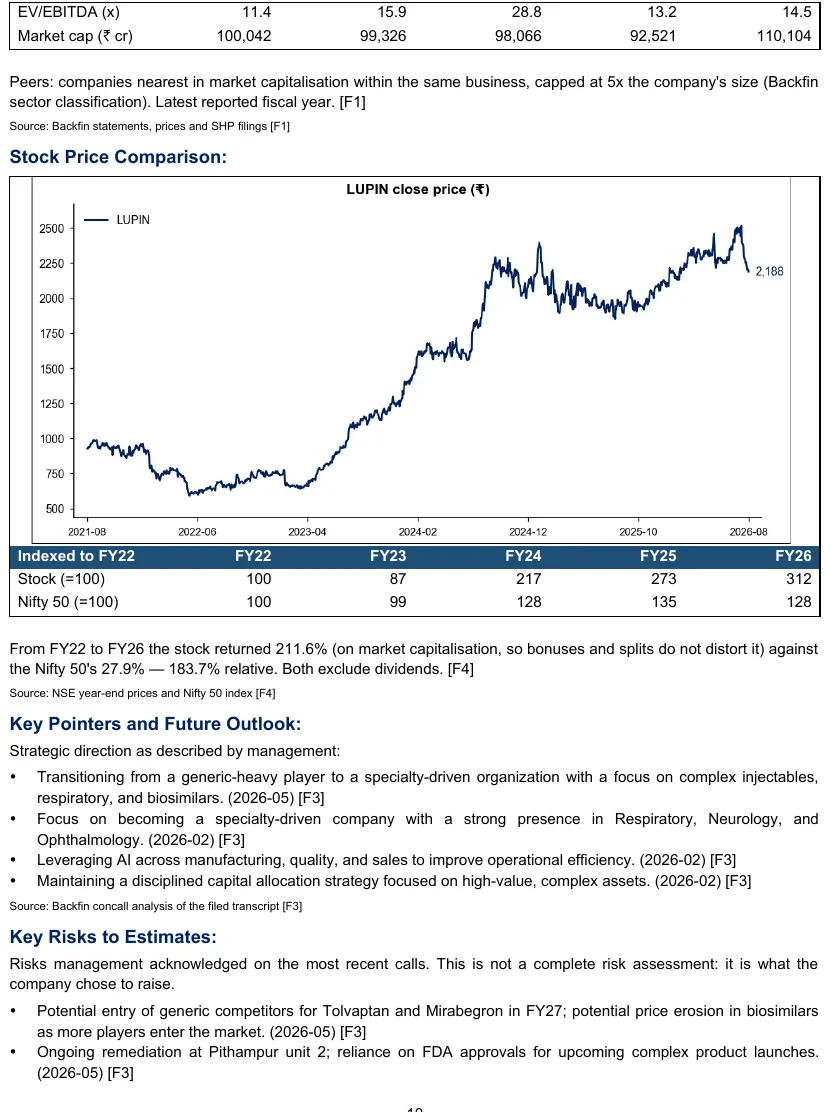
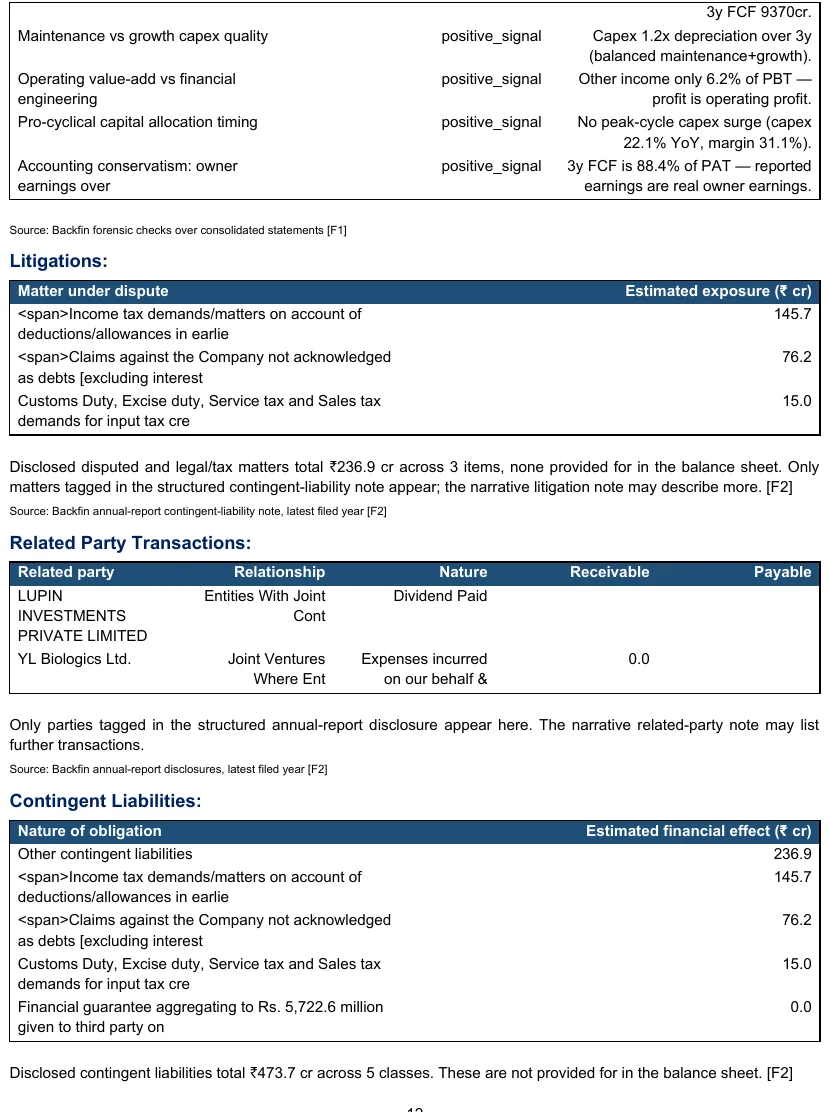
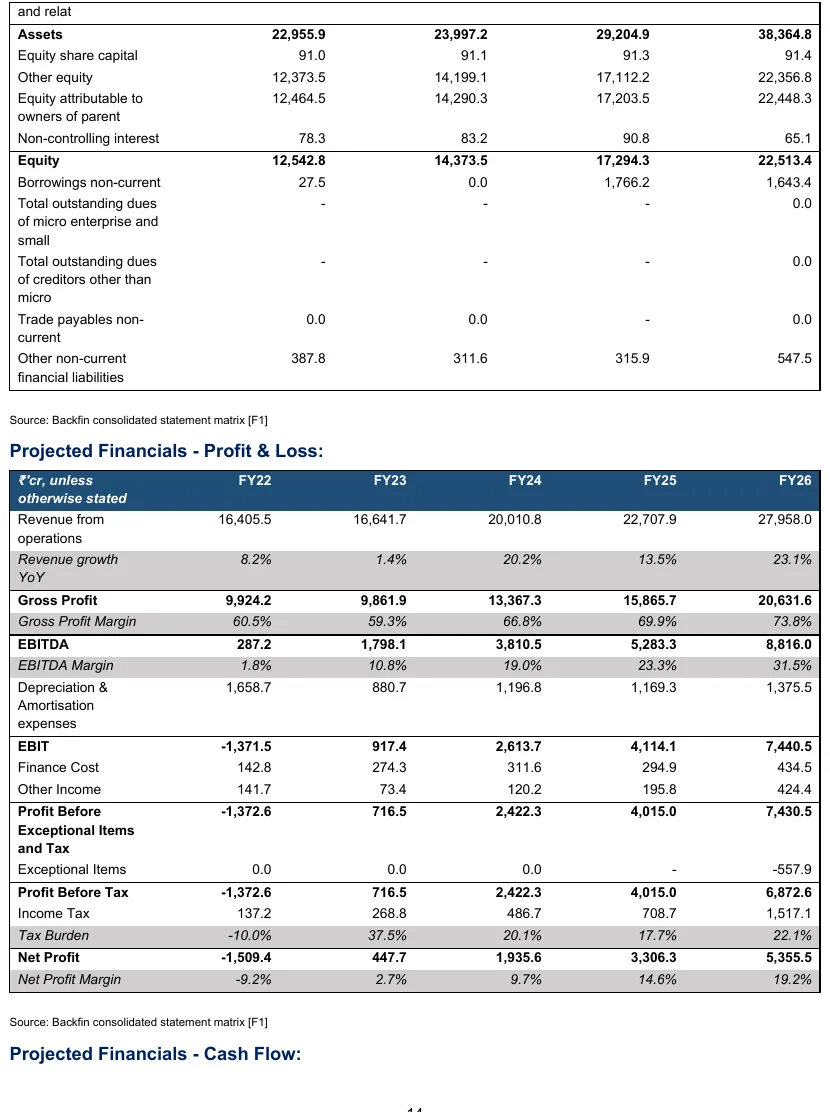
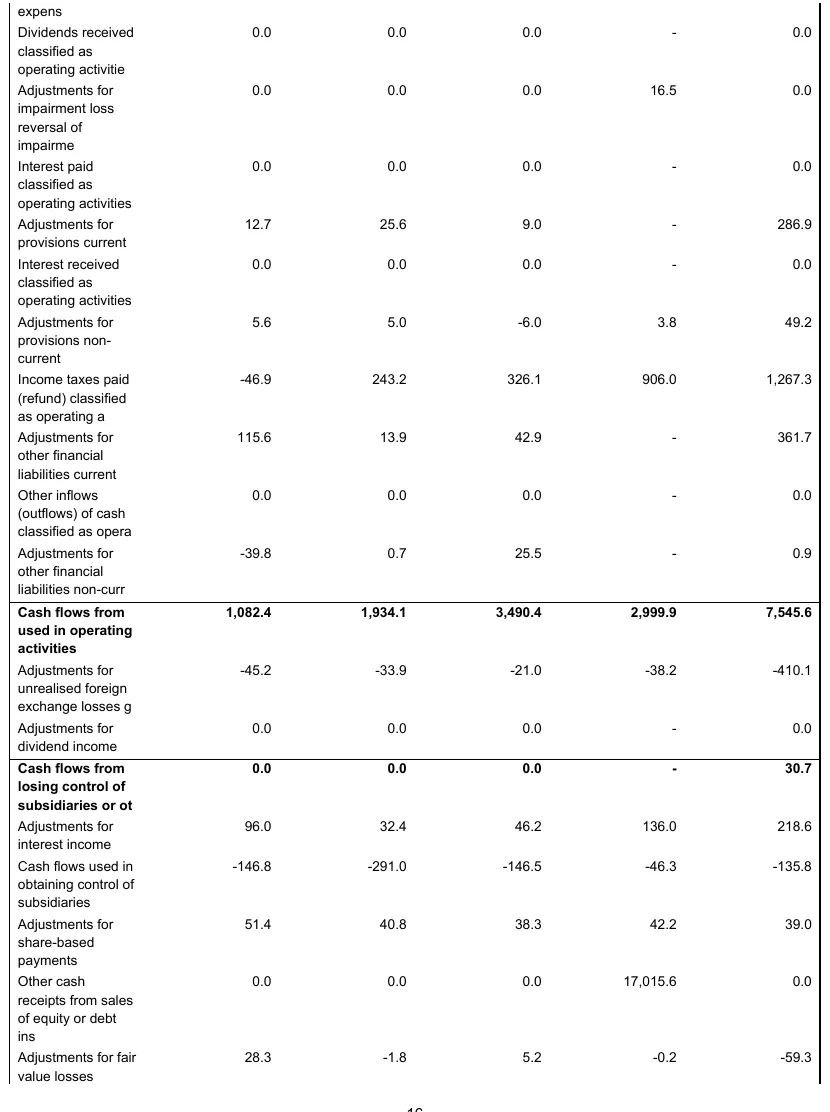
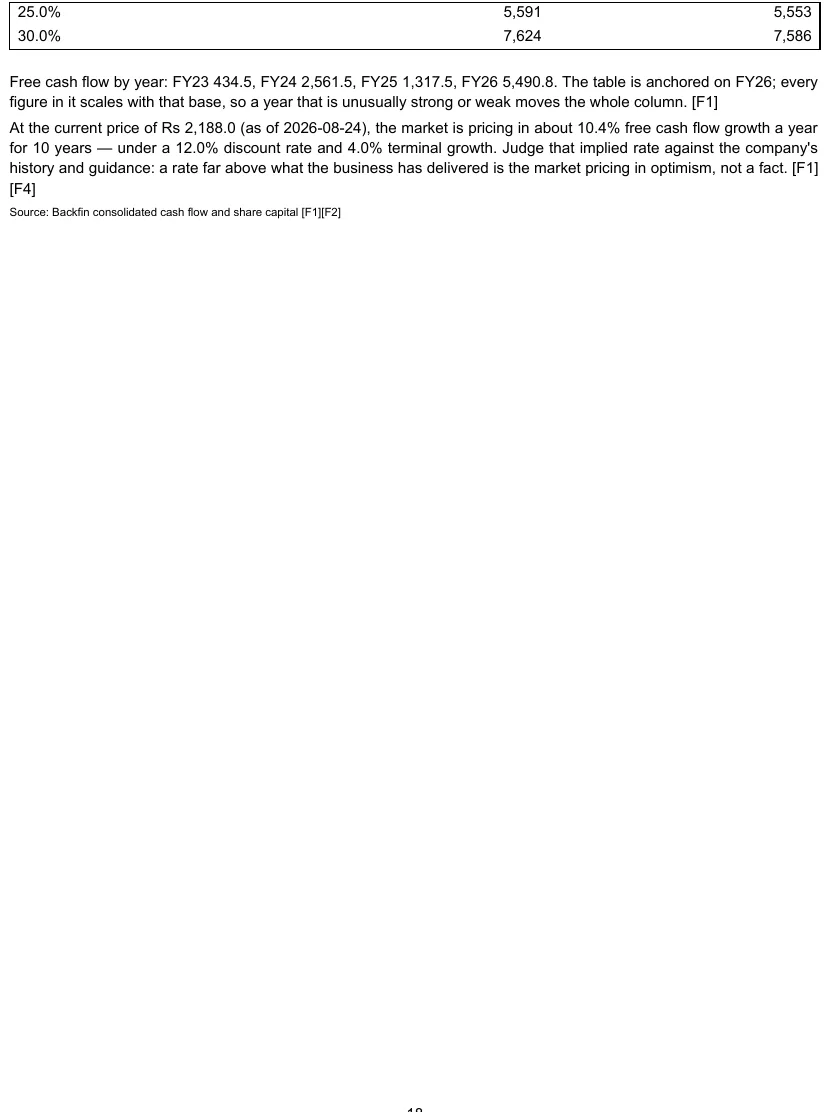
pages 01–02 of 18Page one · rationale, key risks, market data · NOT RATED, recommendation omitted · Understanding business · group overview · subsidiaries
The template is yours
Forty-four sections in your order, your page one, your sidebar, your palette and table styles. A section your filings cannot fill is removed, never padded with ours.
The model is yours
Your own workbook, refilled for each company. Every formula, named range, chart and sheet survives, because the filler may only write into input cells that already hold a value.
Only the numbers are ours
Each one read from a filing and tagged with it. Your rating scale, disclaimer, contact block and any house prose come from one file you keep, and the header says NOT RATED until your analyst signs.
1,888companies with a generated model
437with a written initiating-coverage report
386with a quarterly update note
3,318live formula cells in Lupin’s model · none overwritten
A section with nothing to say is omitted, not padded. The delivered document either carries content or does not carry the section.
The template, meeting real filings
Forty-four addressable. Thirty-four written.
The report follows a broker’s house format, forty-four sections in a fixed order. Each is built from a named store or not at all. Four are the analyst’s alone: the rating, the recommendation, the disclaimer and the contact block. What a company’s filings do not support is removed from the document, heading and all.
34of 44 written
Four sections have no builder at all, company journey, manufacturing, product portfolio and value creation, and appear only when an analyst writes them. Industry overview carries only what management said on the call, because external market research is not in the filings.
Sources
Every figure, with the document it came from.
Eight tags cover every store the generator reads. Each sentence and each table carries its tag inline; the last page of the report lists what the tags mean. Hover a tag.
The linked model
Sixteen sheets. Not one formula touched.
Your own three-statement workbook, refilled for each company from the same store as the report. The filler may write only into input cells that already hold a value, never into a cell whose value begins with an equals sign. Keep scrolling and it leafs through the sheets.
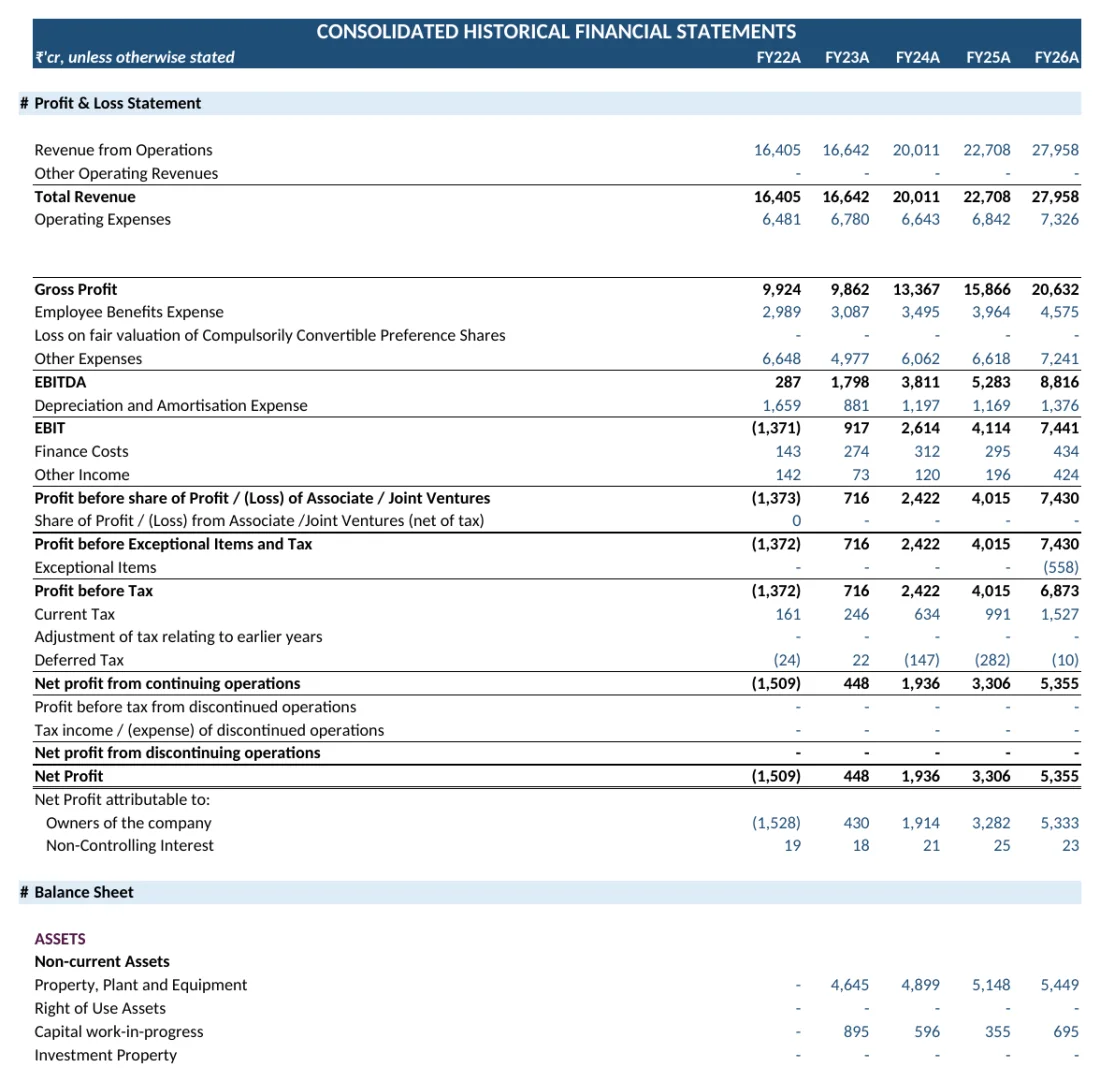
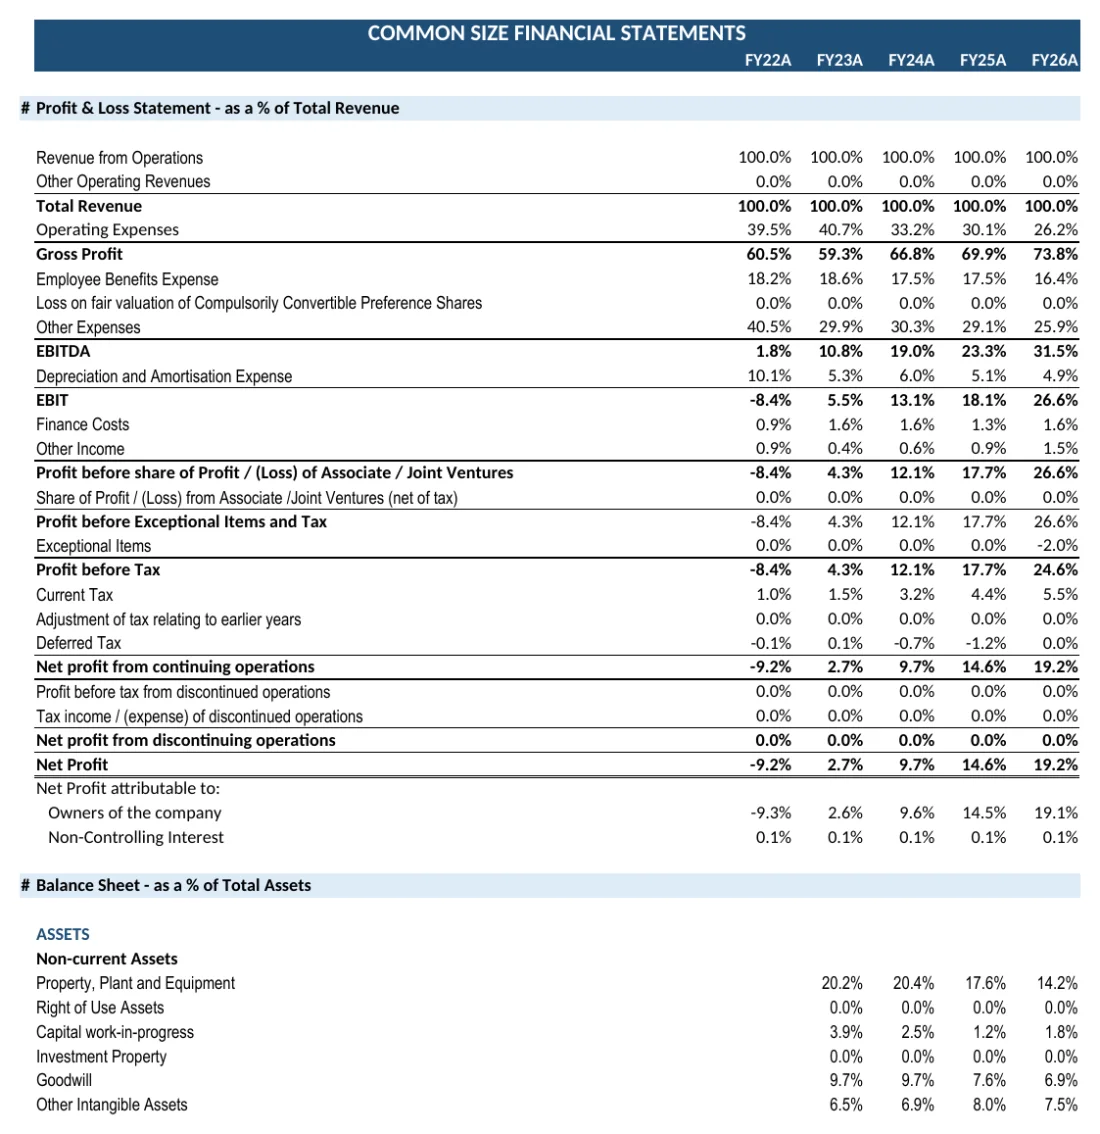
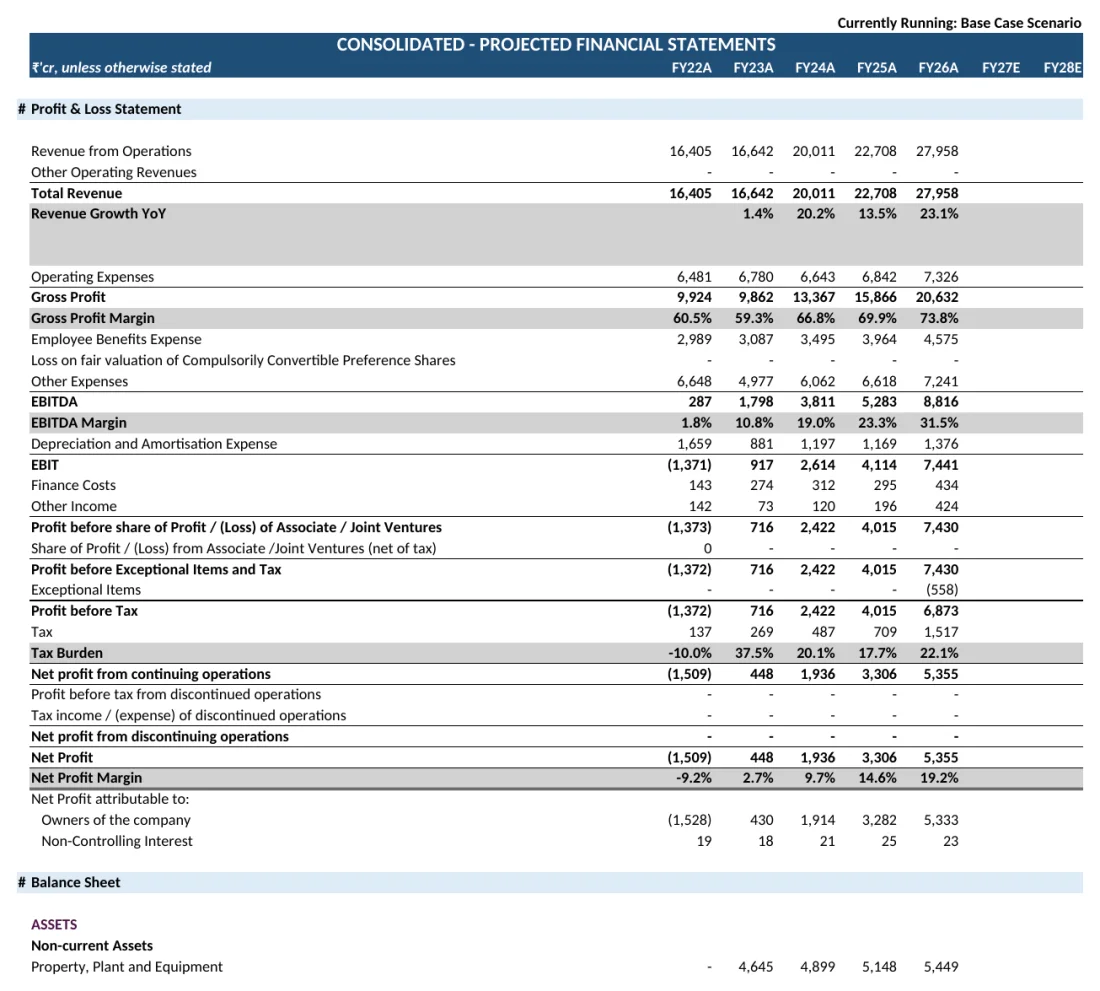
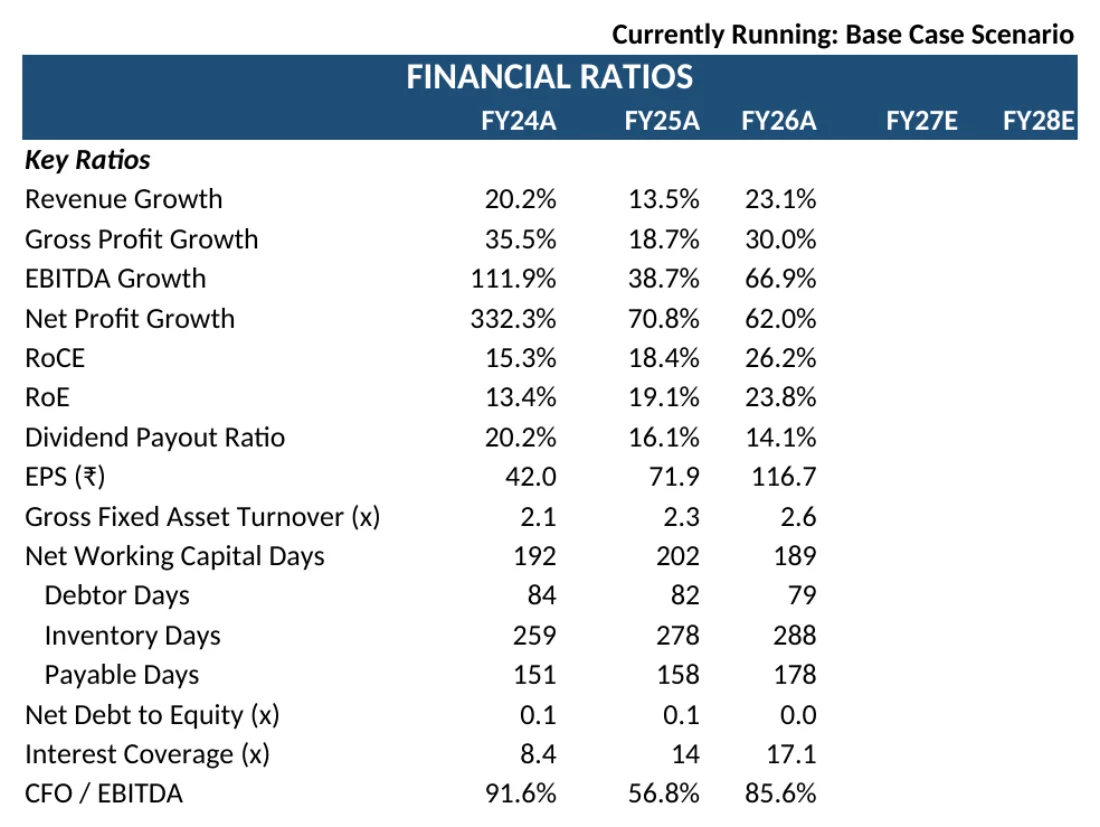
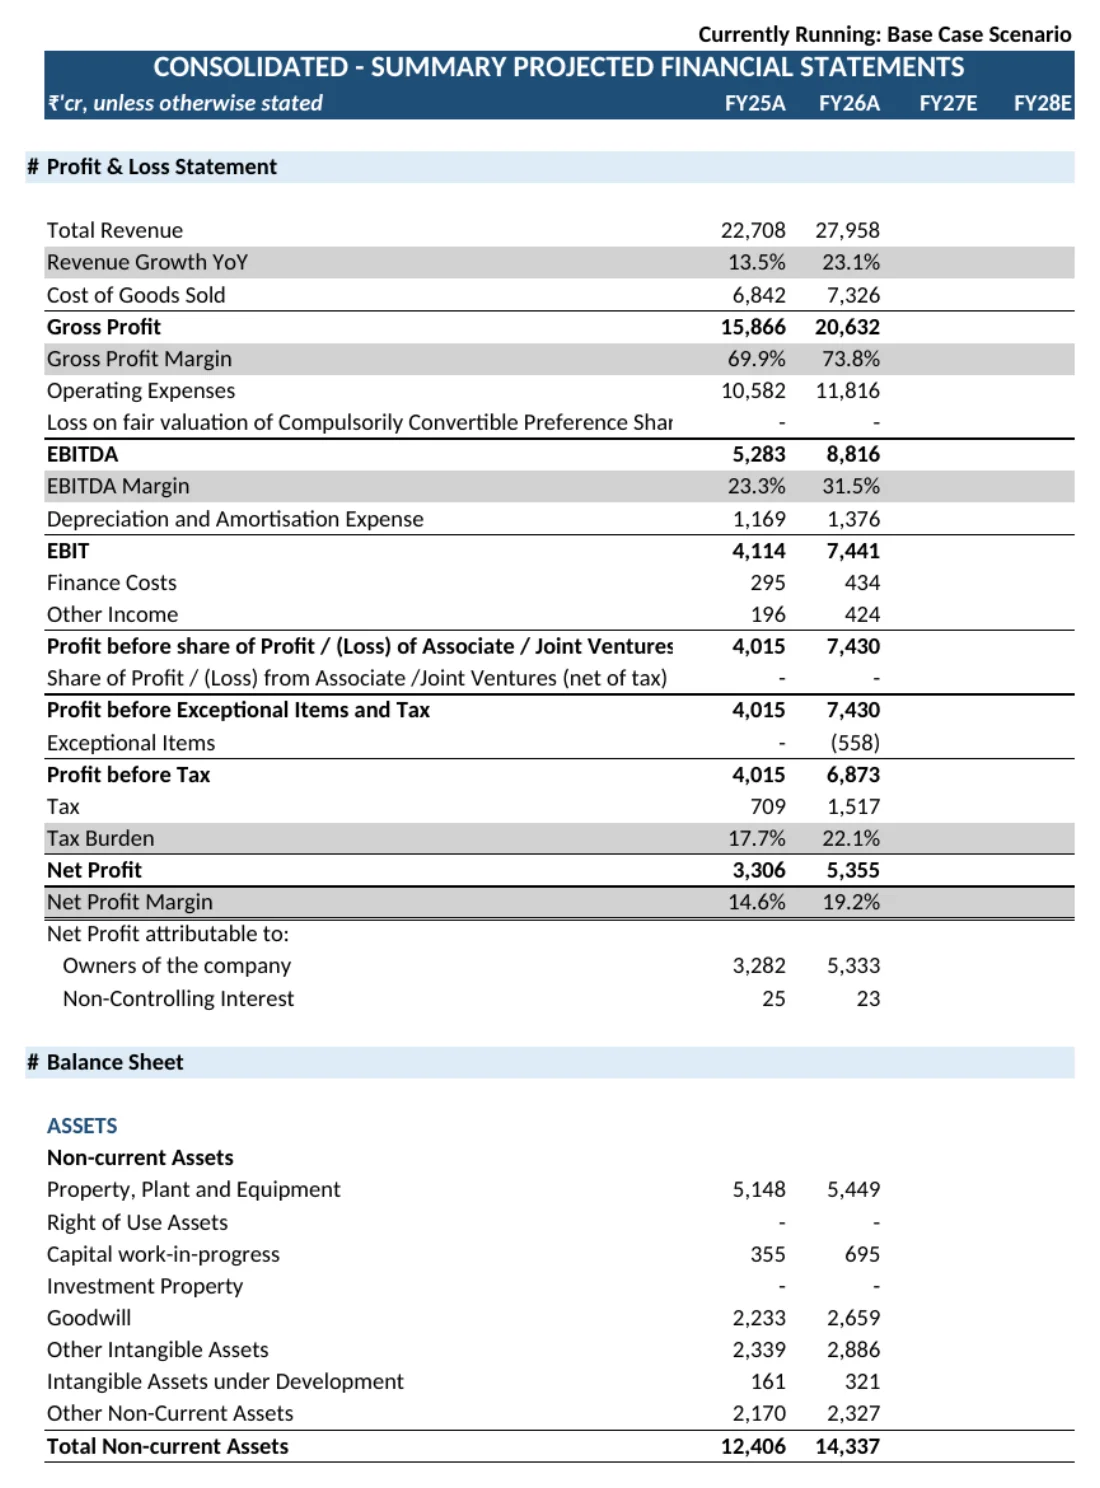
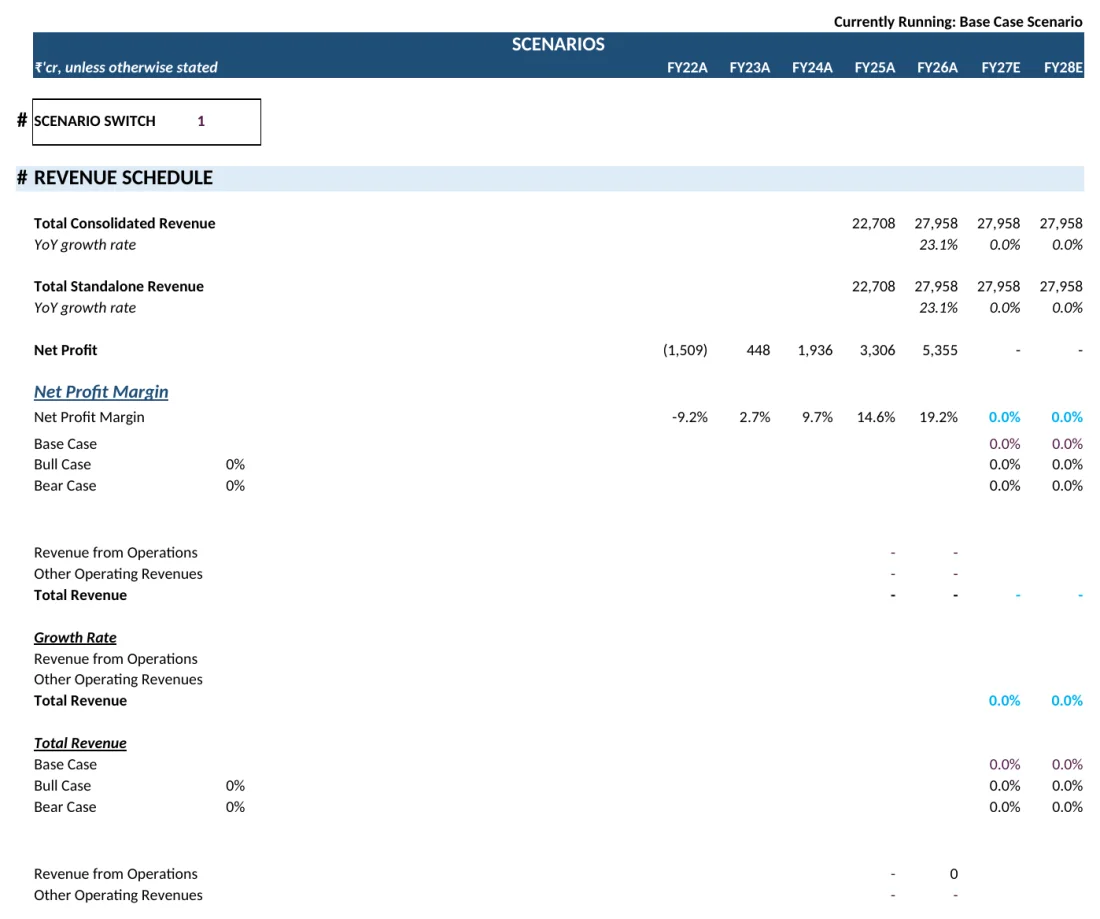
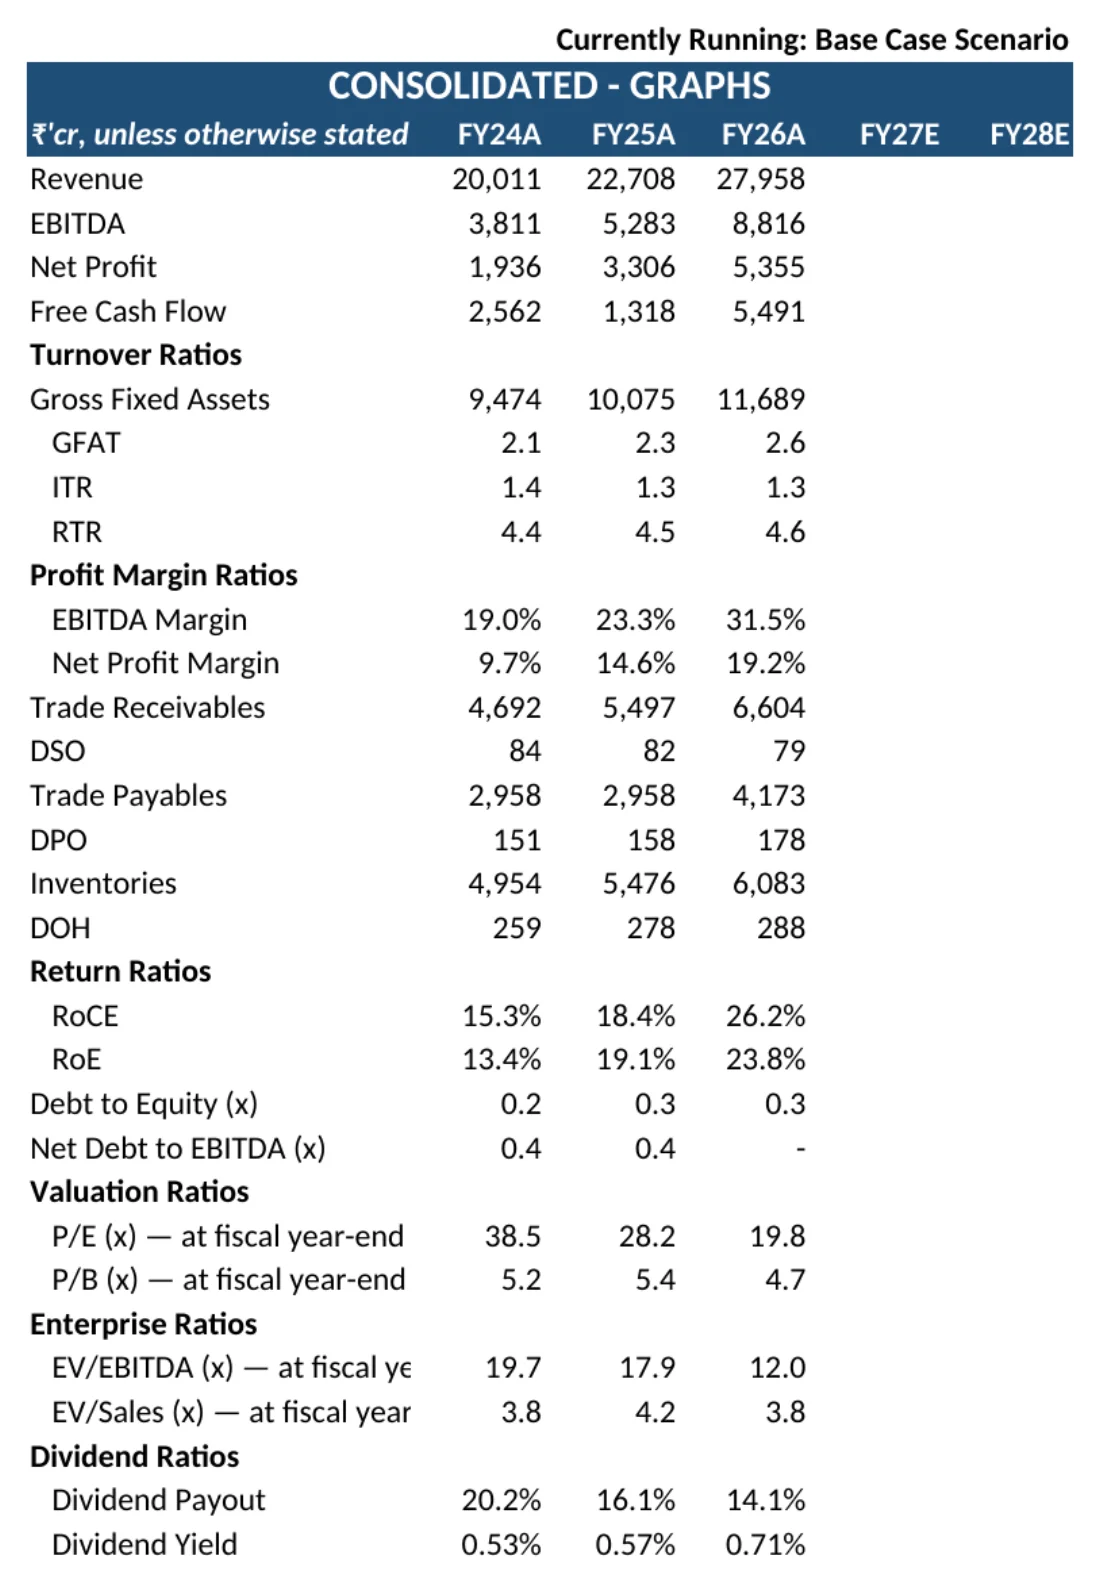
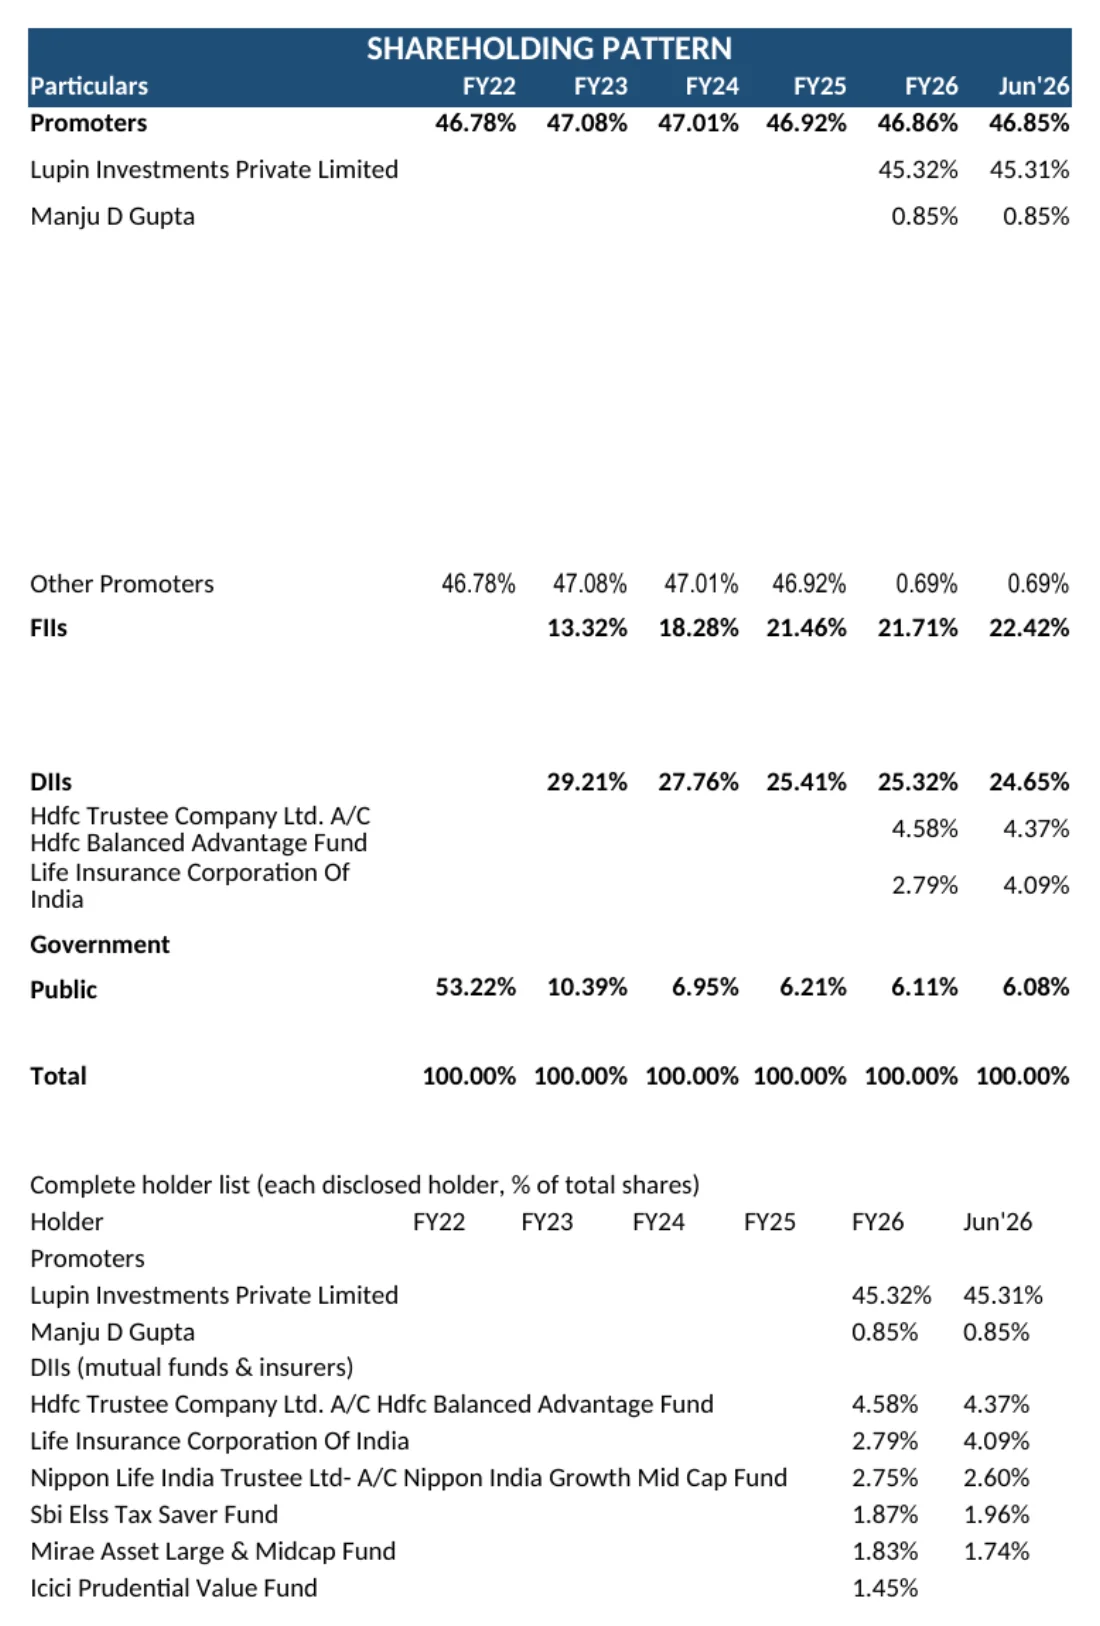
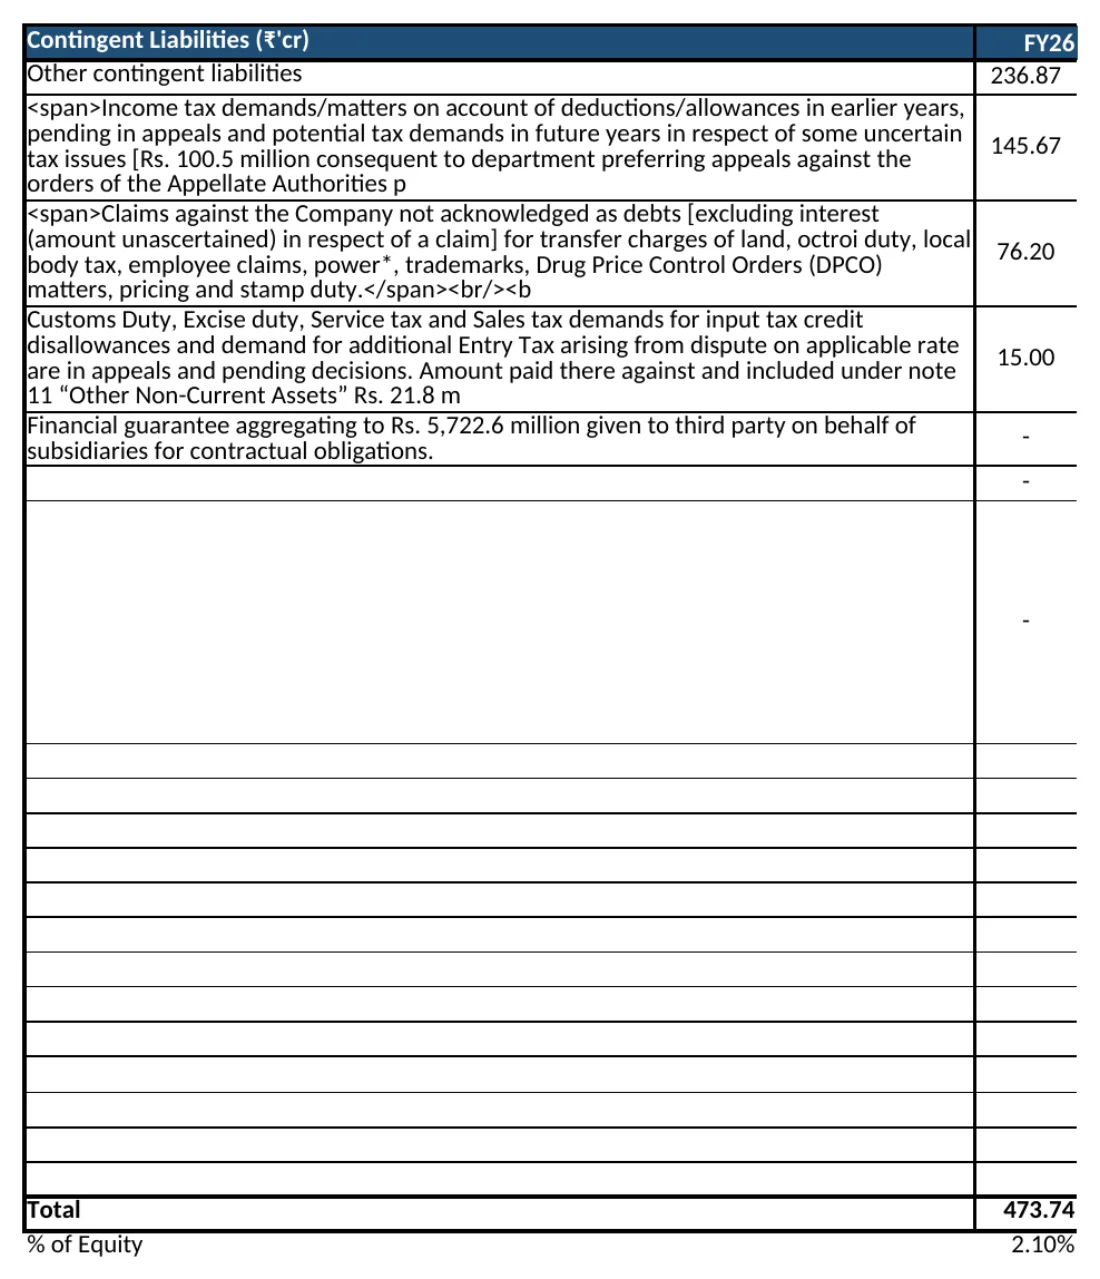
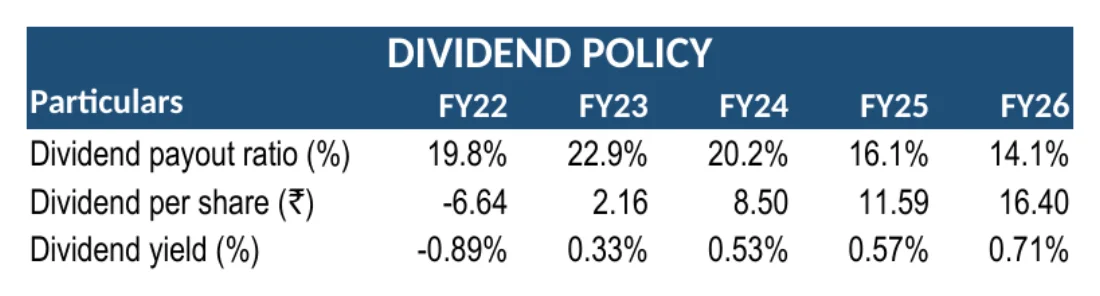
Consol. Historical FSfive filed years, P&L, balance sheet and cash flow · 140 formulas
Before a model is called done
Eight checks. Then it ships.
It patches the Excel package directly, so charts, named ranges and every formula survive. Then the gate runs, and a model that fails it never becomes the baseline.
LUPIN · validation · as printed by the gate
“Never write to a cell whose stored value begins with ‘=’. Preserve formulas, named ranges, sheet order, hidden state, and formatting.”
Results day
The quarter lands. Both refresh.
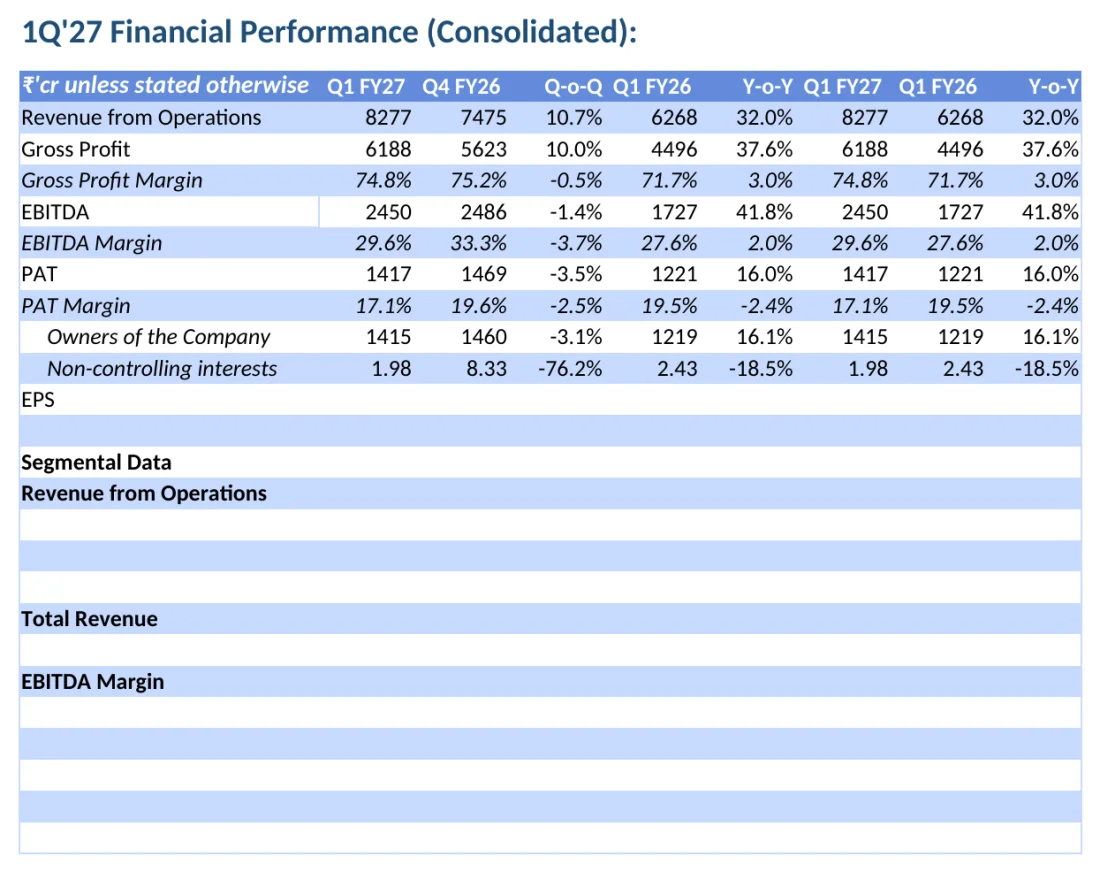
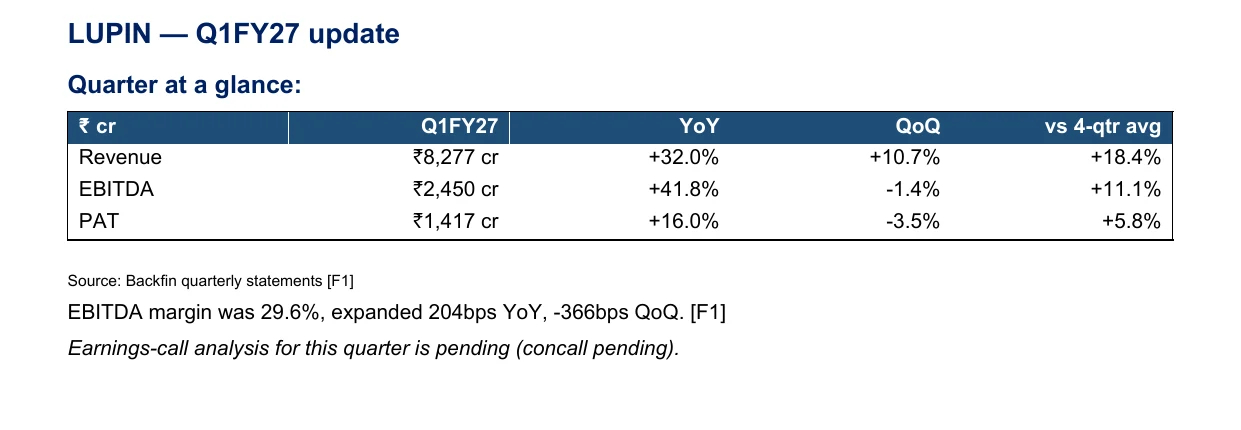
A daily sweep reads the newest quarter for every covered company. When one is new, the model is regenerated, a snapshot is frozen, and a one-page note says what moved against the year, the quarter and the trailing four-quarter average, with margin moves in basis points. A model that fails the gate never becomes the baseline.
LUPIN · Q1FY27 update · quarter at a glance
| ₹ cr | Q1FY27 | YoY | QoQ | vs 4-qtr avg |
|---|---|---|---|---|
| Revenue | ₹8,277 cr | +32.0% | +10.7% | +18.4% |
| EBITDA | ₹2,450 cr | +41.8% | −1.4% | +11.1% |
| PAT | ₹1,417 cr | +16.0% | −3.5% | +5.8% |
Source: FiDUS quarterly statements [F1]
EBITDA margin was 29.6%, expanded 204bps YoY, −366bps QoQ. [F1]
Earnings-call analysis for this quarter is pending (concall pending).
What the sweep can return, per company
A growth figure on a negative base is suppressed rather than printed, because a loss turning to a profit would read as a collapse. A swing is stated in words instead.
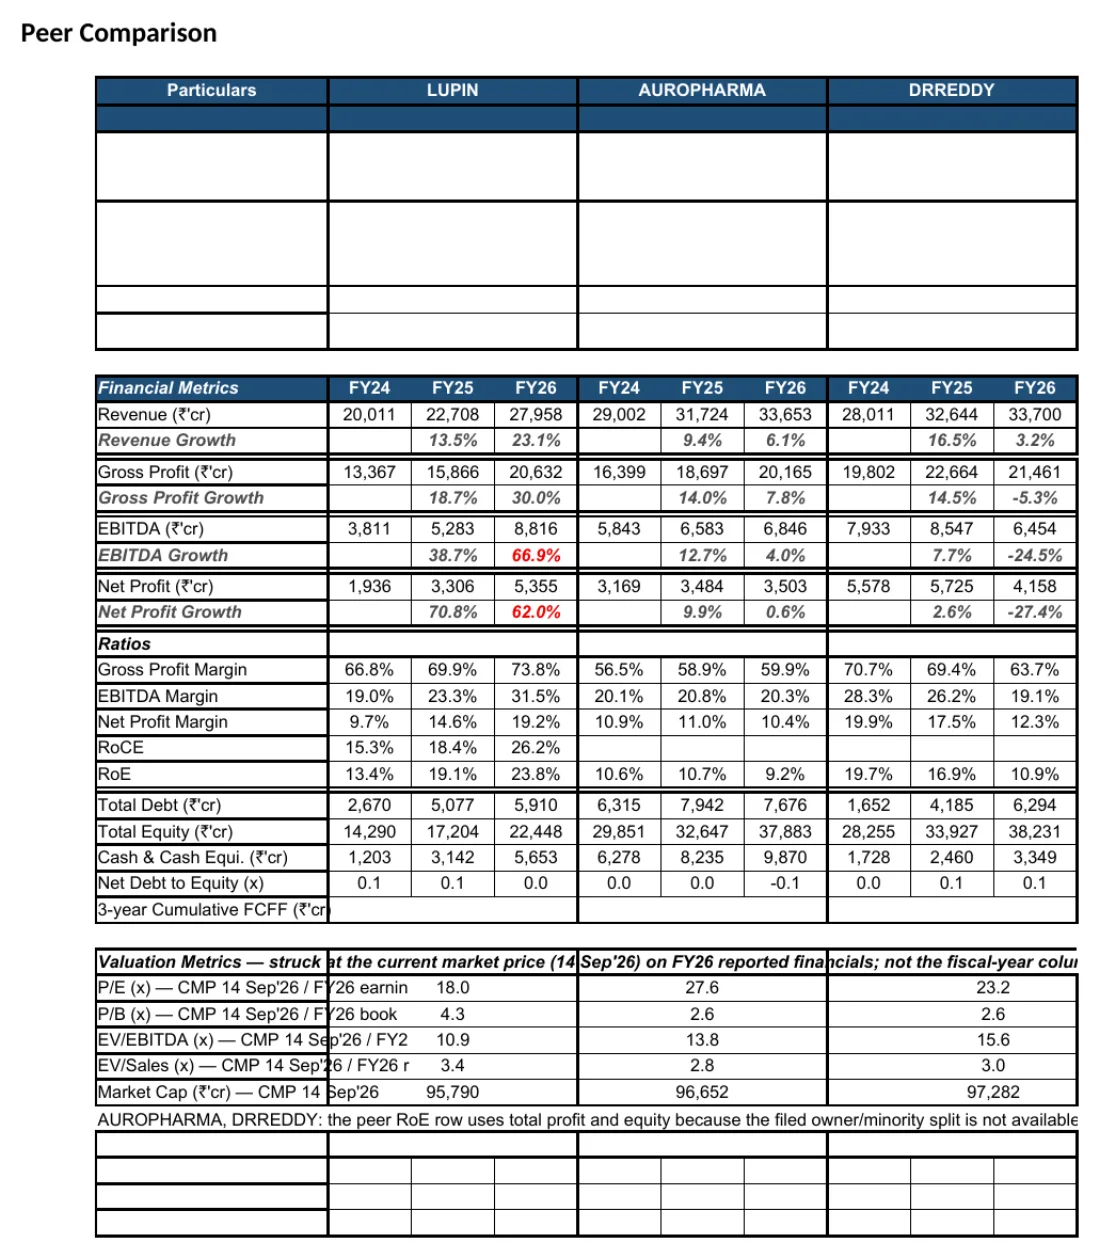
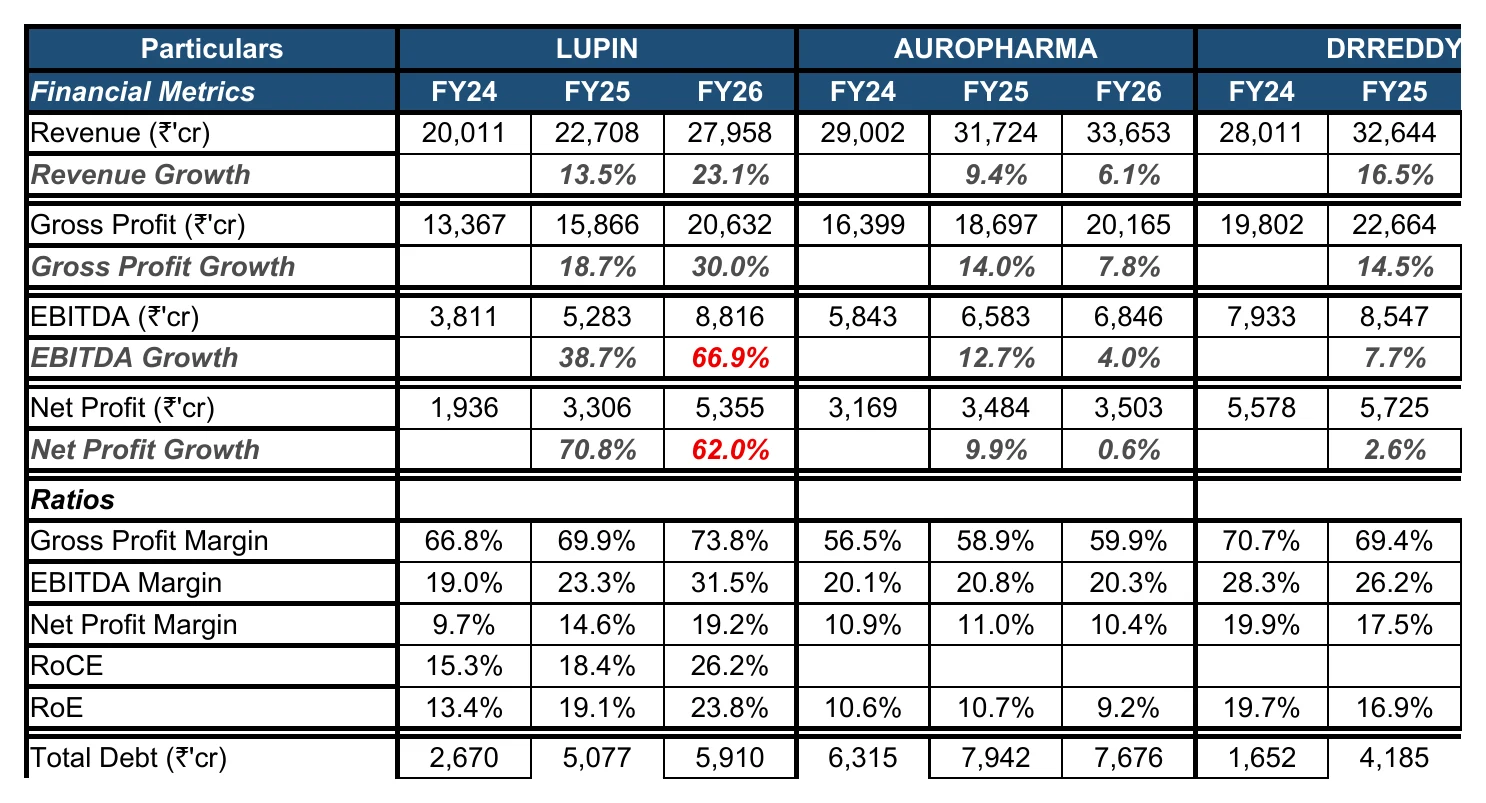
Peer comparison
A comparison, or none.
Peers are chosen by one rule, applied to 684 mapped companies across 117 sub-sectors. The report takes the closest four; the model’s two slots take the closest two. When nothing qualifies, the section says so, rather than compare a company against one five times its size.
the rule
size band 5×, symmetric · stretch to 10× only when the band is empty, at most two, gap stated
“No comparable listed peer: no company in FiDUS’s coverage is in the same business and within 5× of its market capitalisation. A comparison against companies several times its size would not be a comparison, so none is shown.”
By construction
What the analyst keeps.
Target pricenot produced · the projected model ships with its assumptions zeroed
Not ratedwhat the header prints until a registered analyst supplies a rating
rating · recommendation · disclaimer · contact: read from the analyst’s own file, never generated
A bank, an NBFC or an insurer raises before the template is opened: the three-statement model does not apply to them and is not generated. The check reads the filing’s taxonomy and then the interest share of revenue, because the taxonomy alone misfiled a restaurant chain.
Negative free cash flow refuses the reverse DCF. Discount and terminal rates are labelled assumptions in the text. One share count serves the report and the model, so no two surfaces disagree.
Assumption seeding waits on the desk’s own methodology; every model opens flat. Alerting is not built. Reports were last run across coverage on 30 August; models on 15 September.
Where it sits
Not a template. Not a spreadsheet.
The two ways a desk produces an initiating note today: a template filled by an associate over a week, or a model built by hand and rebuilt by hand every quarter. Here is where each one stops.
Setup
One symbol. Two files.
One command produces the report and the model from the same store. The analyst’s copy lives in one JSON file keyed by section, so a rating, a recommendation or a house disclaimer needs no code change. A daily sweep keeps every covered company current.
Next on the bench
Built in the open.
Not shipped yet, listed anyway, so everything above stays exactly what the generator does today.
Base, bull and bear inputs set from the desk’s own methodology, so a model opens with a first draft of the projections rather than flat.
Banks, NBFCs and insurers, 130 companies, excluded today rather than modelled badly.
The sweep already knows when a quarter lands; nobody is told yet.
Desk access
Your template. Your model.
For research desks at brokers and wealth firms. Send your report template and your model workbook, and one symbol you cover. What comes back is your initiating-coverage draft and your model, filled from the filings, for you to mark up against what your desk would have written.
Get accessRequest
access.
Tell us who you are and which product you want to see. A person replies, not a sequence.